- feature
- debugging
- backtesting
Tick-by-tick replay: debug a trading strategy one bar at a time
A backtest equity curve tells you a strategy worked, not why. Backticks replay walks every tick — indicators, signals, and orders, exactly as the engine saw them.
When a backtest finishes with a +12% equity curve, the obvious question is “great, but is this real?”. The less-obvious question — and the one that actually matters — is “which trades made it work, and would they have happened in real life?”.
Most backtesters answer the first question with a chart and the second with a CSV of trade fills. Squinting at timestamps, trying to reconstruct what the strategy thought at the moment it bought, is a slow and error-prone way to verify behaviour.
Backticks replay turns that workflow inside out.
What replay does
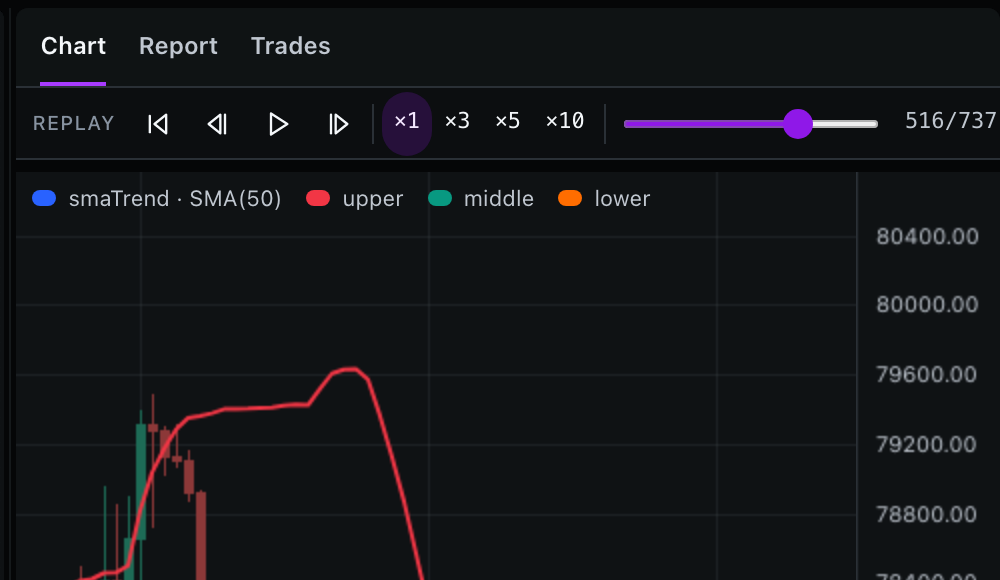
Hit ▶ on a finished backtest. Backticks walks the strategy forward one tick at a time, painting:
- The current bar as it forms — the same partial OHLC the engine sees mid-bar in production.
- Indicator values updating on every tick, exactly as the strategy reads them.
- Signal-node states flipping (e.g.,
RSI < 30going green) the instant the underlying condition becomes true. - Order placement, fill, and PnL update on the timeline, with a marker on the chart at the exact tick.
Pause anywhere. Step forward by tick or by bar. Drag the timeline to jump. Every visual on the screen — the chart, the indicators, the trade table, the PnL number — is a snapshot of what the strategy actually saw at that moment.
The bug class it catches that nothing else does
The most expensive class of strategy bug isn’t “wrong logic”. It’s “right logic, wrong assumption about when the engine sees a value.” Common patterns replay surfaces immediately:
- A signal that fires on the bar’s close, then trades at the same close. The equity curve looks great because the strategy keeps “buying the dip”. In replay, the signal node turns green at the exact tick the close prints — and the entry order fills at the next bar’s open, which is dramatically different. The strategy is real-life-fine; the eyeballed result was a hallucination from a bad mental model.
- An indicator that lags by one bar. Replay shows the value updating after the order, not before. The entry condition was reading yesterday’s RSI all along.
- A “rare” trade that’s actually frequent. The PnL summary shows 18 trades; the chart shows two clusters because the strategy traded back-to-back inside a single volatile bar. Replay walks every fill in order, so the real cadence becomes visible.
These are bugs that pass the equity-curve sniff test. They only show up when time can be stepped through.
How it works under the hood
Every Backticks backtest runs deterministically — same inputs, same outputs, byte-for-byte. Replay leans on that property in two ways:
The engine emits a structured event log as it iterates. Every bar arrival, indicator update, signal evaluation, order placement, and PnL change is a typed event with a timestamp.
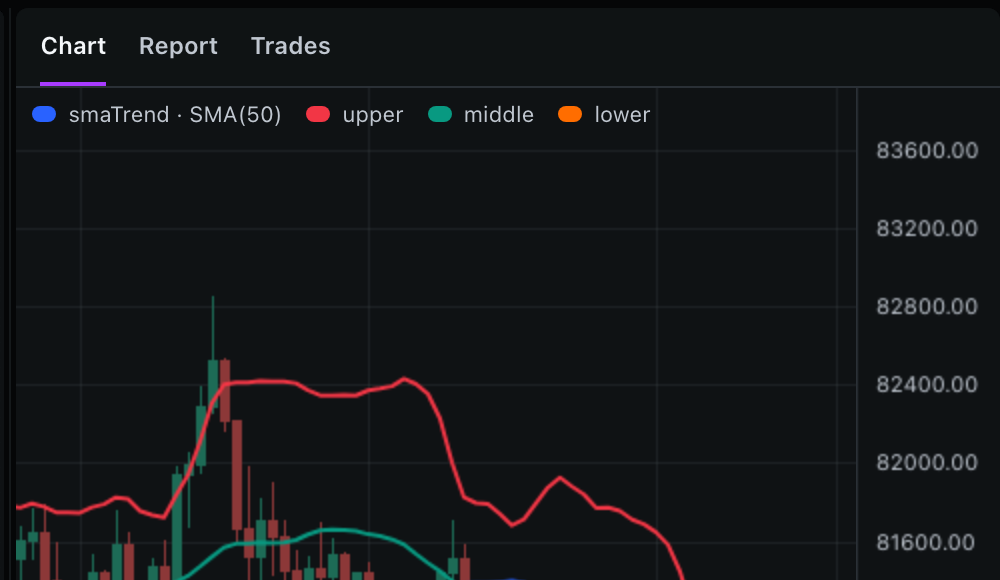
Replay re-renders the chart from the event log, not from a separate “live” simulation. The strategy isn’t being re-run — what’s painting on screen is what the engine recorded. That’s why scrubbing the timeline is instant.
For tick-level granularity (intra-bar replay), the engine reconstructs the partial OHLC from a stored running snapshot, so the bar visible mid-formation is the same partial bar the strategy saw mid-progress. No interpolation, no fudge.
This is also why replay is honest about the look-ahead-safety guarantees: there’s no way to fabricate a tick the engine didn’t see, because the renderer literally only knows what’s in the event log.
Why this matters more than a prettier equity curve
A backtest equity curve is a marketing artefact. It’s the smallest amount of information a strategy can communicate.
A strategy’s behaviour — when it acts, when it doesn’t, what changes its mind — is the actual asset. If behaviour isn’t inspectable, the equity curve isn’t trustable.
Replay is what makes behaviour inspectable. Strategy review goes from “look at the result” to “watch the decisions”. After debugging a few strategies that way, going back to staring at trade-list CSVs feels like flying blind.
Open any strategy in the studio and hit ▶ Replay on a backtest result. Step through the trades — chances are at least one of them will surprise you in a way that’s worth fixing before any real money is on the table.